KiwiSaver has finally hit a speed bump shrinking for the first time to end the September quarter at $96.2 billion. That’s down around $2 billion from June.
This was entirely due to market movements and to be expected, says Morningstar data director of Asia-Pacific Greg Bunkall.
“As a growing product, inflows have overshadowed outflow and market movements but as KiwiSaver matures we can expect market movements to have more impact leading to more ups and downs in the overall KiwiSave balance. It’s normal and to be expected.”
Market maturity means providers need to start thinking about KiwiSaver as a traditional investment product with ups and downs in market movement and no longer in terms of guaranteed revenue growth, he says.
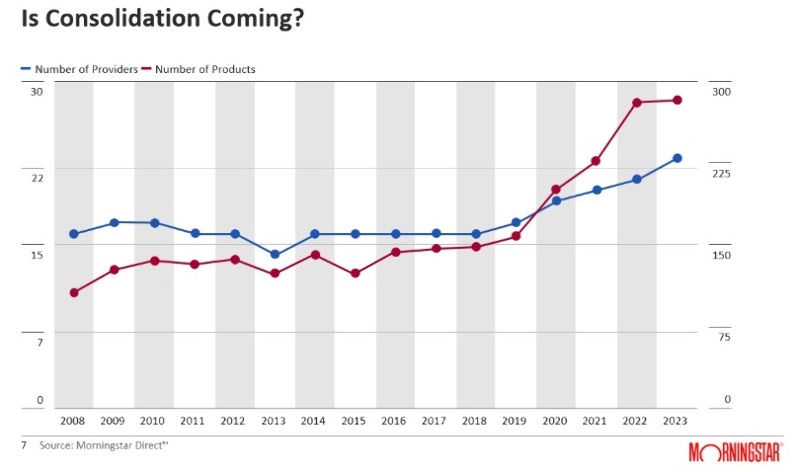
Recently there has been a significant increase in options and providers particularly with white label funds brought onto platforms such as InvestNow and KiwiWRAP and offered as KiwiSaver.
Bunkall until this point, New Zealand hadn't had the same level of proliferation as Australia, but the trend there is reversing with the number of super funds falling from 170 to about 120. ”Regulators are really trying to increase the scale at which the super funds operate. Australia Super, for instance, is a A$263 billion fund in assets and it anticipates to be at A$500bn at 2026. QSuper and SunSuper, which were about the same size were put together and are about the same size as AustraliaSuper with similar growth aspirations.”
Bunkall says Morningstar anticipates increased scale, heightened competition, larger member balances, passive investment strategies and regulatory pressures.
Drawing insights from what we can see overseas we would expect these trends to persist and continue downward pressure on fees.
Fees reduced but expensive funds grow
In KiwiSaver multi sector categories, about $310 million worth of fees were generated in 2016, more than doubling in the last six years to around $645m.
While the industry has experienced great revenue growth, the average fee paid by members per dollar has decreased by about 9%. In 2016, this was about 87 basis points which has been reduced to 80. But that 9% decrease has been masked by investors moving into more expensive funds i.e., from conservative to growth products generally.
In 2016, conservative and moderate categories, which are cheaper, accounted for about 45% of assets under management and now make up only 27%, says Bunkall. “Investors have preferred to shift more recently into growthier, more expensive,
KiwiSaver options. That has meant a lot of the fee deductions in those more expensive categories have been negated. If we actually look into it, the average balanced category has gone down by 16% and the average growth has gone down by 22%.”
Asset allocation
Investors are starting to take note, checking their risk profile and moving towards growth funds. In 2011 overall asset allocation was 60% income and 40% growth. This is now more like 45% income and 55% growth.
This shift is not uniform across providers, though. Analysis of the banks, Milford and Fisher Funds revealed some quite varying splits with one of the most conservative providers members split 50/50, while one of the most aggressive providers coming in at 61/39 towards growth.
“A provider with 50/50 is going to have a lot of headwinds trying to generate market share compared to one focused on market progression,” says Bunkall.
Exposure to international equity ranges from 30% to 50%, NZ equities from 9%-18% and alternatives from 0%-9%.
For the September quarter the five largest KiwiSaver providers accounted for approximately 68% of assets and fees but the landscape is changing. ANZ led the market share with more than $18.8 billion followed by Fisher (15.5%) which knocked ASB back to third place. BT (Westpac) dropped to the fourth spot ahead of Milford, which debuted in the top five.
Almost all multisector KiwiSaver funds produced negative returns over the September quarter. Average returns from the multisector category after fees and before tax ranged from -1% for conservative funds to -3.1% for the aggressive category. Among the defaults, SuperLife did best, losing the least.
Over 10 years, the average annual return for aggressive funds was 8.0%, followed by growth (7.6%), balanced (6.1%), moderate (4.3%), and conservative (3.9%).
Over longer periods, Quay Street, Milford and Generate continued to perform well across the categories in most periods.